Technical deep dive · PatchCore · MVTec AD

PatchCore Evaluation & Localization

Detailed evaluation material from the anomaly-detection project: PatchCore's normal-memory approach, real localization outputs, metric selection under extreme pixel imbalance, threshold behavior, and category-level results.

PatchCore, simplified

PatchCore builds a compact reference of normal local image features. At inference time, patches from a new image are compared with that normal memory. Larger distances indicate regions that differ more strongly from the normal reference.
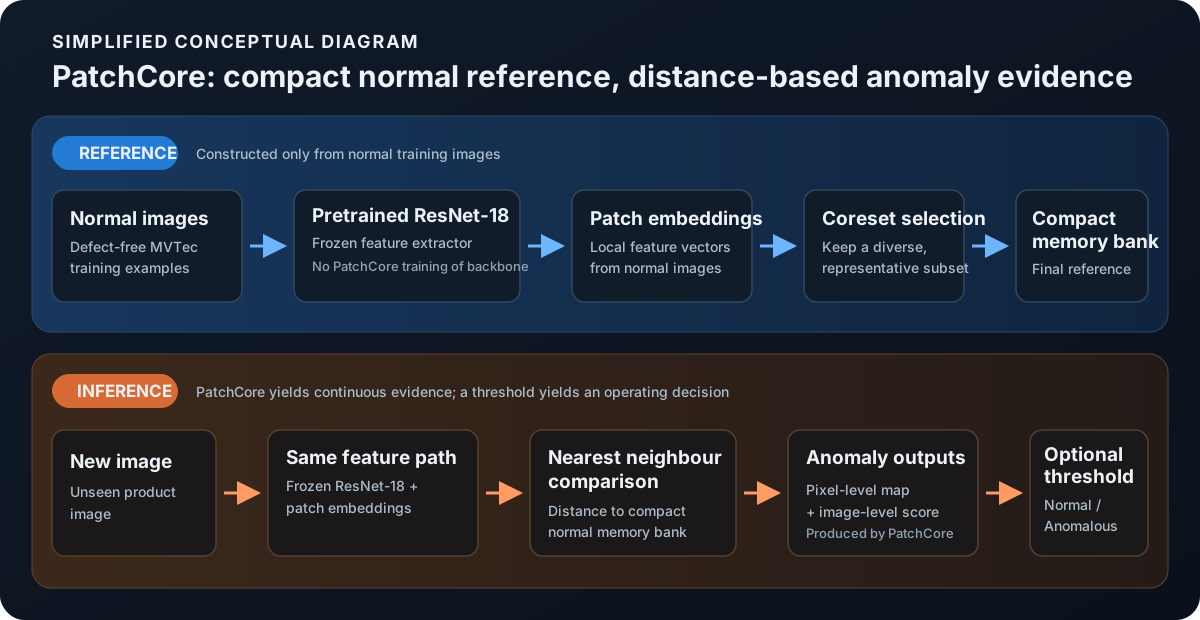
Simplified conceptual diagram showing normal images passing through a frozen pretrained ResNet-18 into patch embeddings, coreset selection, and a compact memory bank; inference compares new patch embeddings to that memory and applies an optional threshold to PatchCore scores
Simplified conceptual diagram. A frozen pretrained ResNet-18 produces patch embeddings. Coreset selection reduces the normal embeddings into the compact memory bank. PatchCore returns continuous anomaly maps and scores; a chosen operating threshold converts those scores into a decision.

Same flow in compact form

Qualitative PatchCore results

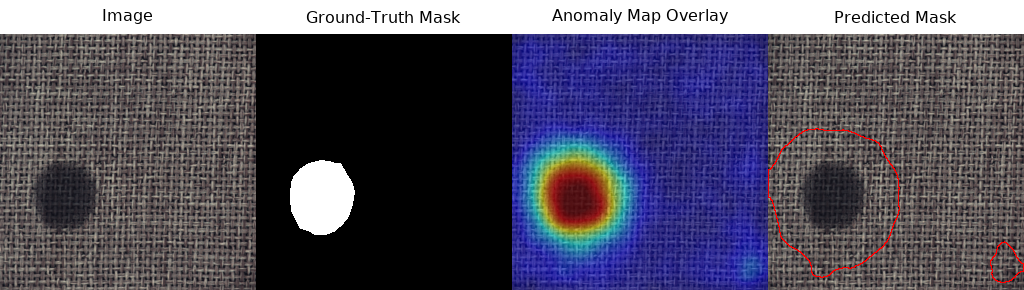
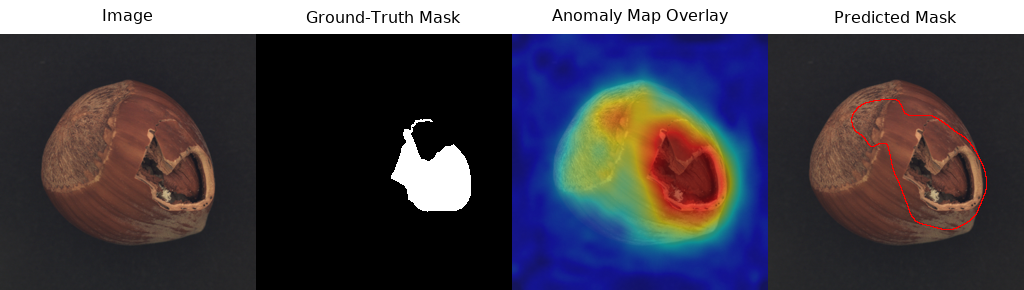
These are real outputs from evaluated PatchCore runs across four MVTec AD categories. Each result shows the input, ground-truth mask, continuous anomaly-map overlay, and the thresholded prediction.
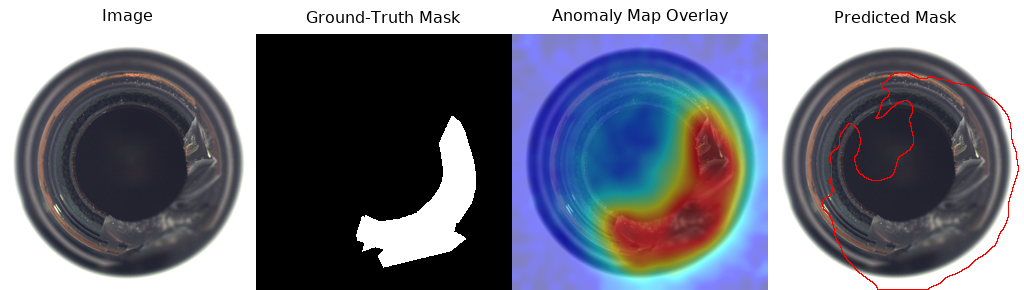
PatchCore four-panel result for a bottle with a large broken rim
Bottle · broken large. The anomaly response follows the damaged rim, with some spill around the circular boundary.
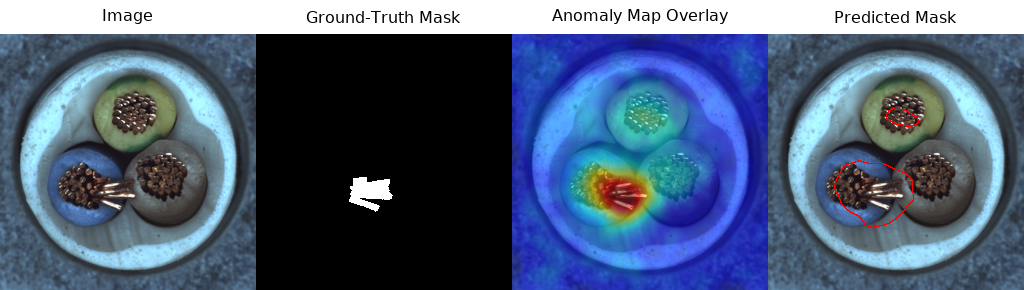
PatchCore four-panel result for a cable with a bent wire
Cable · bent wire. The strongest response is concentrated on the displaced copper strands, with a smaller secondary response elsewhere.
PatchCore four-panel result for a carpet color defect
Carpet · color defect. A compact high-score region aligns with the discolored patch against the repetitive textile background.
PatchCore four-panel result for a cracked hazelnut
Hazelnut · crack. The response covers the opened shell and the thresholded contour tracks the dominant damaged region.

Selected from regenerated PatchCore outputs used in the project evaluation. Open any result for a full-size view.

Evaluation choices

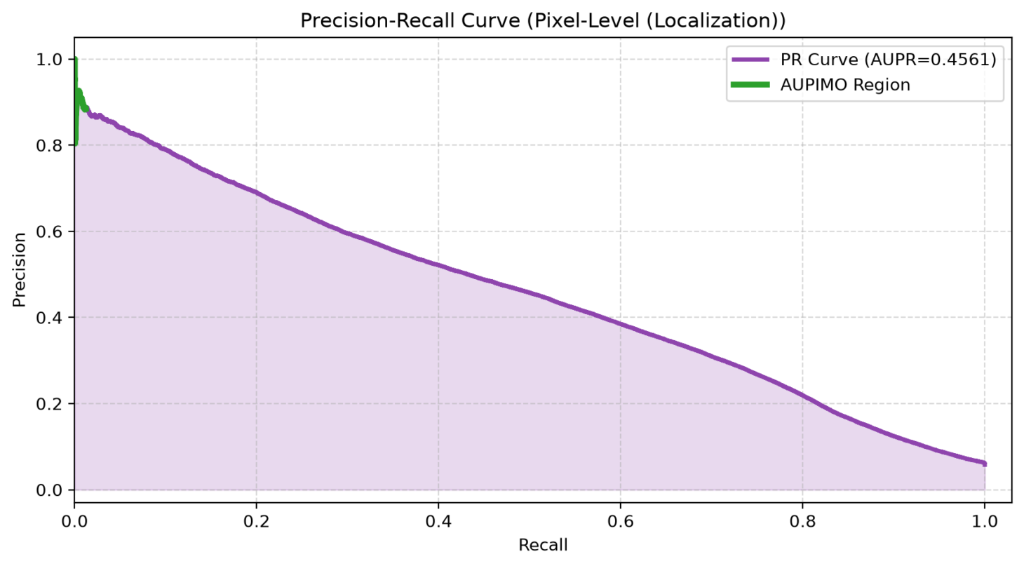
Pixel AUROC can remain high because normal pixels dominate the denominator of the false-positive rate. The project therefore uses AUPIMO as the main localization metric and F1 plus precision-recall behavior at image level, with threshold sensitivity treated explicitly.

The EDA also showed strong category heterogeneity. A Kruskal-Wallis test across defect-area distributions gave H = 626.5 with p = 1.2 × 10-124, while anomalous-pixel ratios ranged from roughly 0.34% for screw to 14.5% for metal nut.
Spatial distribution analysis from the project report
Spatial structure. Defect location and morphology vary by category, creating a risk that a detector learns positional shortcuts.
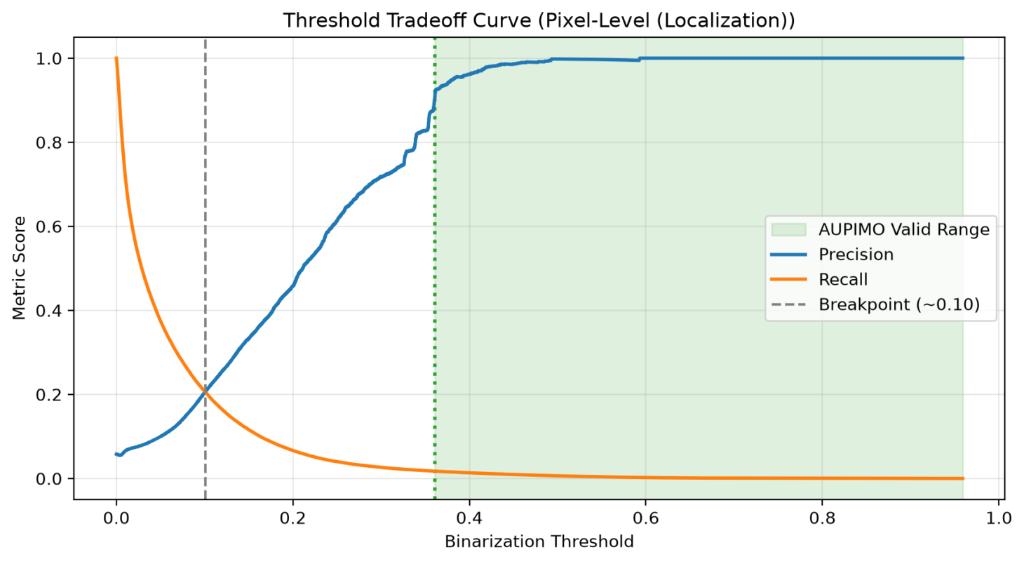
Threshold sensitivity analysis from the project report
Threshold sensitivity. The operating point is a precision-recall trade-off rather than a single universal score.

Evaluated PatchCore baseline

0.929mean image-level F1
0.988mean image-level PR-AUC
0.603mean pixel-level AUPIMO

Across the completed 15-category baseline, localization varied substantially by category: AUPIMO reached 0.982 for bottle and 0.972 for leather, while zipper fell to 0.251. Screw was the hardest image-level category at F1 0.796.

The weaker categories direct attention to representation scale, preprocessing, coreset construction, smoothing, threshold calibration, and evaluation configuration.