Evaluation: detection and localization are different questions
An industrial anomaly system has two jobs that should not be collapsed into one score:
One score per image. We care about precision, recall, F1 and PR-AUC, then choose an operating threshold.
One score per pixel. We care about whether the highlighted region overlaps the real defect while keeping false alarms extremely low.
A continuous anomaly score is not a factory decision until a threshold turns it into pass/reject or normal/anomalous.
| Metric | Formula / idea | What it answers |
|---|---|---|
| Precision | TP / (TP + FP) | Of the parts we rejected, how many were actually defective? |
| Recall | TP / (TP + FN) | Of the real defects, how many did we catch? |
| F1 | 2PR / (P + R) | One operating-point summary balancing precision and recall. |
| PR-AUC | Area under the precision-recall curve across thresholds. | How good is the precision/recall trade-off without committing to one threshold? |
| Pixel AUROC | Ranks anomalous pixels above normal pixels across thresholds. | Useful global ranking metric, but can be overly forgiving when almost every pixel is normal. |
| AUPIMO | Area under per-image overlap curves in a strict shared low-FPR range. | How well do we localize each defect when normal images are allowed almost no false-positive pixels? |
Precision vs PR-AUC: the distinction I want to remember
Precision is one point. It is calculated after choosing a threshold. Change the threshold and the precision usually changes. PR-AUC summarizes an entire threshold sweep. It tells us whether the model maintains useful precision as recall changes, but it does not itself define the deployed threshold.
Why pixel AUROC can look better than the heatmap
In our data, roughly 98% or more of the pixels in a defective image can still be normal. Pixel AUROC uses false-positive rate, whose denominator contains a huge number of normal pixels. A visibly annoying false-positive region can therefore represent only a small fraction of all normal pixels and move the FPR surprisingly little. That is one reason we did not use pixel AUROC alone for localization.
AUPIMO: what it means and how we used it
AUPIMO stands for Area Under the Per-IMage Overlap curve. The metric was introduced to make anomaly-localization evaluation stricter when common pixel metrics are saturated or tolerant of false positives. The key idea is that each anomalous image gets its own overlap/recall curve, while the curve's horizontal axis is indexed by a false-positive rate measured from normal images.
An AUPIMO score asks: “Across a very strict range where the model produces almost no false-positive pixels on normal images, how much of the real defect can it still recover in each anomalous image?”
Calculation in our final evaluation
Both models' maps and masks are canonicalized to 256×256. Continuous maps use bilinear resizing; masks use nearest-neighbour resizing and remain binary.
At each threshold, pixels above the threshold are treated as anomalous.
Because normal images contain no defect pixels, any predicted positive pixel is a false positive. This shared FPR indexes the same threshold sweep for every image.
For each defective image, we measure how much of its ground-truth defect is recovered at each threshold.
Our implementation used FPR bounds from 10-5 to 10-4.
Anomalib integrates each PIMO curve inside those bounds and normalizes the area to [0,1]. The reported category score aggregates the per-image scores; the project comparison then reports macro means across all 15 categories.
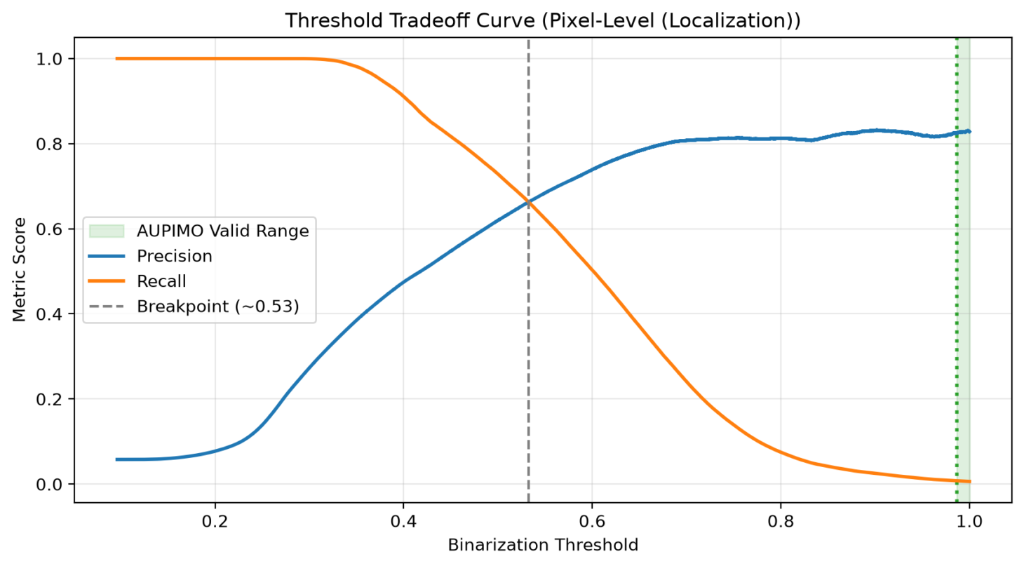
Important distinction: AUPIMO's shared FPR axis is calculated from normal images in the final evaluation set because that is part of the metric definition. This is separate from the image-classification decision threshold, which we calibrated only on held-out normal validation data and froze before final test inference.
Metric references: Bertoldo et al., AUPIMO · official AUPIMO implementation · Anomalib metric reference.
Threshold calibration: a score is not yet a decision
Every model produces continuous scores. To make a binary image decision, we need a threshold. In the final comparison we split each category's official normal training partition once into 85% fitting and 15% validation with seed 42. The model is fit only on the 85% partition; the decision threshold is derived only from the held-out normal validation scores.
threshold = 95th percentile(normal validation image scores)Using the 95th percentile means that, by construction on that validation sample, 95% of normal validation scores fall at or below the threshold and 5% fall above it. It does not guarantee exactly a 5% false-positive rate on future production data; distribution shift and finite samples still matter.
The evaluation correction was part of the project, not housekeeping
At one stage, PatchCore and the Keras CAE had been evaluated through different fitting, threshold-calibration and pixel-metric paths. That meant their historical numbers were not strictly comparable. Rather than treating this as a cosmetic implementation issue, I rebuilt the comparison around a shared protocol.
Same data membership
Identical 85/15 normal split, seed 42, and exact ordered path lists.
No test leakage
Fit on 85%; calibrate thresholds on 15% normal validation; freeze before test scoring.
Same pixel preparation
Maps and masks canonicalized to 256×256 through one path.
Same metrics
Shared pixel AUROC, full-map AUPIMO, image confusion counts and protocol metadata.