Project in 60 seconds
The core problem was to detect and localize defects when training data is overwhelmingly normal and the defective region can occupy only a tiny fraction of an image. We treated image-level detection and pixel-level localization as separate evaluation questions, then rebuilt the comparison around a common deterministic protocol so model conclusions were actually comparable.
Exploratory analysis and reporting; metric and threshold design; autoencoder and ResNet experiments; PatchCore implementation/evaluation; fair deterministic evaluation corrections; and DINOv2/DINOv3 experiments using patch-level representations and nearest-neighbour anomaly scoring. The integrated repository is a team artifact and also contains substantial work by Benjamin Förster, Mahboubeh Nadaf and Karim Khalifa.
Why this was harder than a normal image classifier
Industrial anomaly detection is an open-ended problem: training data contains many good parts, defects are rare, and a future defect may not resemble any labeled failure seen during development. The useful setup is therefore to learn what “normal” looks like and score deviations from that reference.
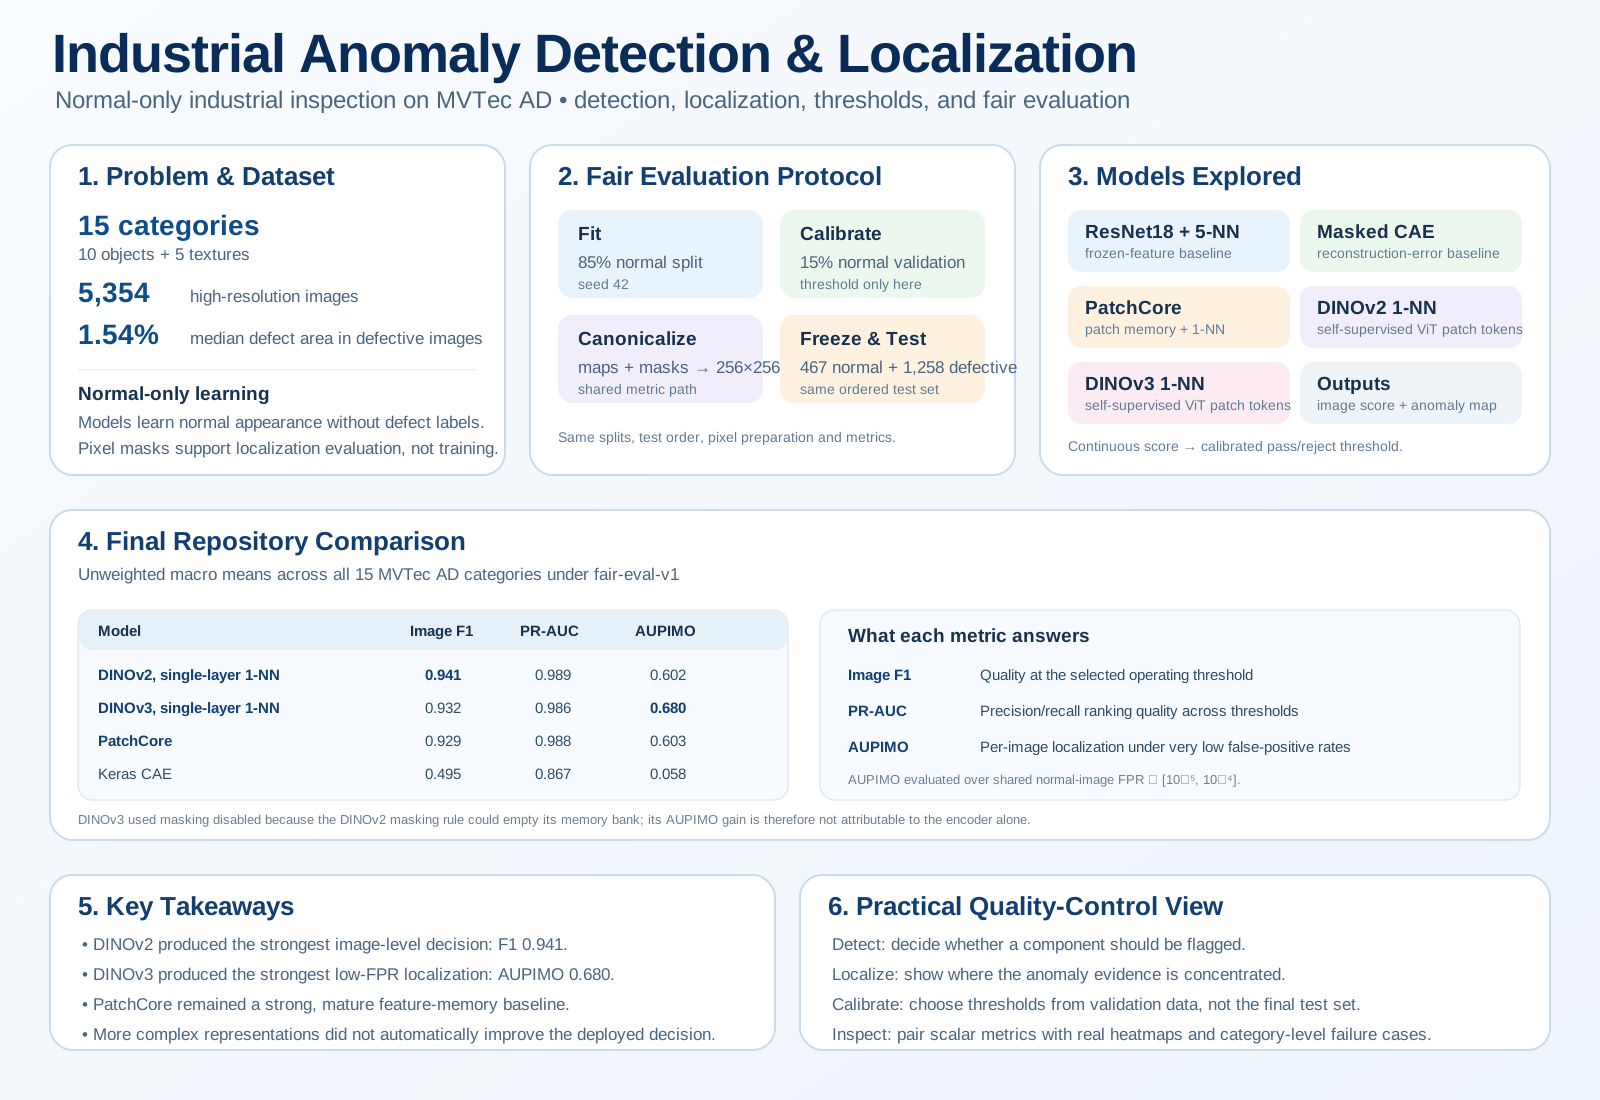
The localization problem was particularly imbalanced. The median defective region occupied about 1.54% of an image, one quarter occupied less than 0.49%, and some defects were around 0.037%. That made apparently strong pixel metrics easy to misread and pushed us toward low-false-positive localization metrics and qualitative inspection.
Final comparison under one protocol
After correcting data membership, threshold calibration and metric paths, all models were compared under fair-eval-v1. Image F1 was the primary deployed decision metric; PR-AUC provided threshold-independent context; AUPIMO measured localization under a strict low-false-positive regime.
| Model | Image F1 | Image PR-AUC | AUPIMO |
|---|---|---|---|
| DINOv2, single-layer 1-NN | 0.941 | 0.989 | 0.602 |
| DINOv3, single-layer 1-NN | 0.932 | 0.986 | 0.680 |
| PatchCore | 0.929 | 0.988 | 0.603 |
| DINOv2, enhanced | 0.920 | 0.983 | 0.545 |
| Keras CAE | 0.495 | 0.867 | 0.058 |
The most useful result was not simply which model scored highest. A comparatively simple frozen representation plus nearest-neighbour memory performed extremely well, while a more elaborate DINOv2 variant improved some pixel metrics but reduced image F1 and AUPIMO. Complexity had to earn its place.
The project became an ML system, not a notebook collection
The final repository includes deterministic manifests and splits, Pixi environments, tests and linting, model-artifact caching, FastAPI and Streamlit interfaces, preprocessing components, explicit evaluation workflows and a defense-oriented inspection surface. Reproducibility and protocol identity became part of the modelling work rather than cleanup at the end.
Technical deep dives
The detailed material is separated by question so the overview stays readable without losing the technical record.
Precision, recall, PR-AUC, AUPIMO, threshold calibration and the fair-eval-v1 correction.
ModellingModels & experimentsCAE, ResNet, PatchCore, DINOv2/DINOv3, project evolution and failed or misleading directions.
EvidenceInspection & localizationInteractive category gallery, PatchCore memory-bank mechanics, qualitative heatmaps and baseline behavior.
ArtifactsReports & defenseEDA report, technical report, final business report and the September 2026 defense presentation.
What I would carry into another anomaly-detection project
PR-AUC describes ranking across thresholds; precision, recall and F1 describe behavior after choosing one.
Reproducible splits, cache identity, threshold provenance and metric consistency can change the conclusion as much as a new model.
A global score can hide spatially ugly false positives or missed small defects.
A strong frozen representation plus nearest-neighbour scoring can reveal whether additional architectural complexity is justified.