Interactive inspection gallery: all 15 categories
These are the curated PatchCore outputs used by the defense demo. Select a category to inspect two real evaluated examples. The images are precomputed results, not browser-side model inference.
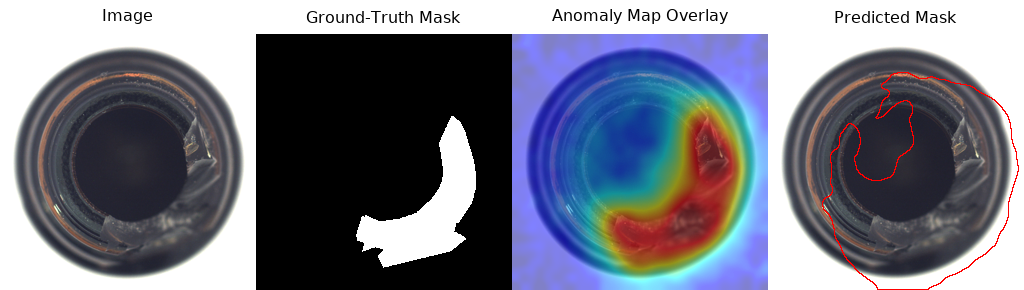
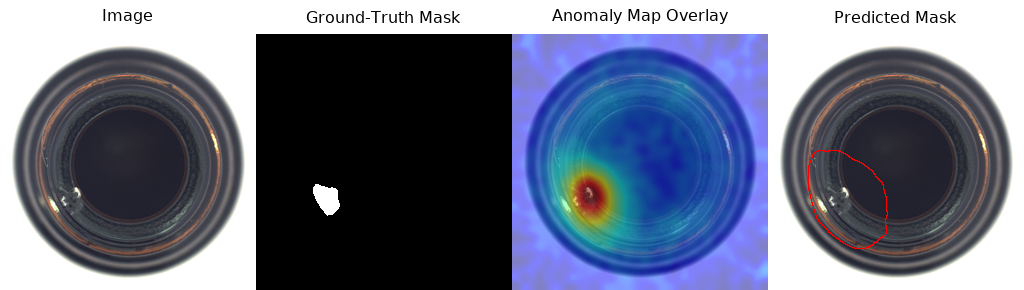
Source imagery: MVTec AD. The project records the dataset under CC BY-NC-SA 4.0; these derived evaluation panels are shown here for educational/project documentation with attribution. MVTec AD dataset · project data-license note.
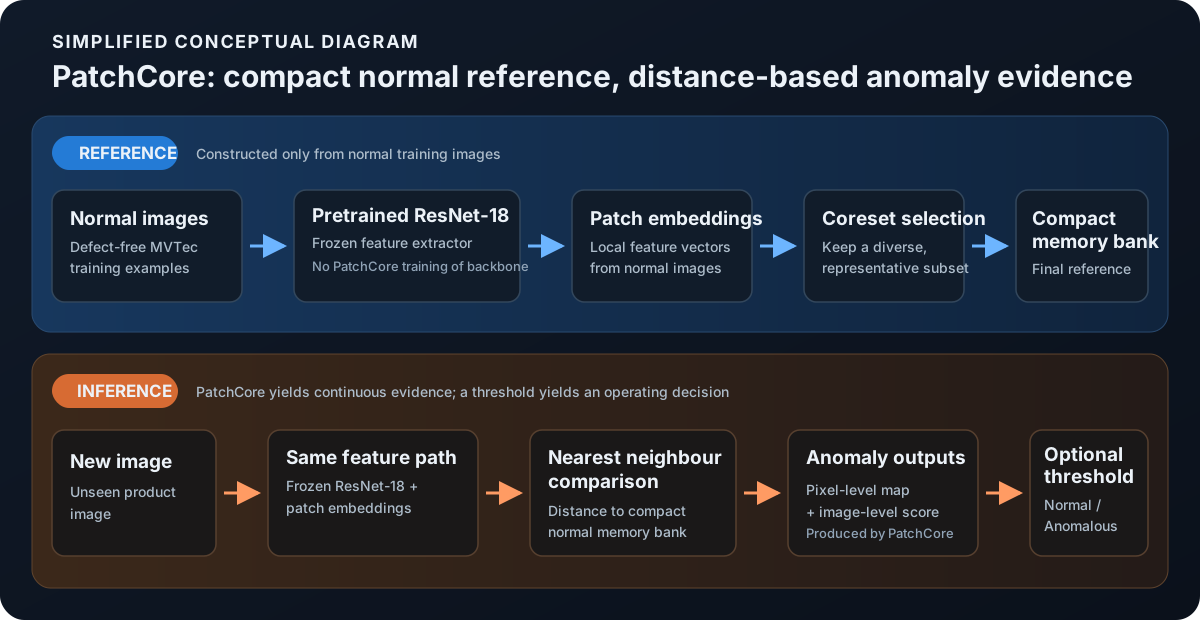
PatchCore reference-memory approach
PatchCore builds a compact memory of normal local image features and scores test patches by their distance from that reference.
Qualitative localization results
These evaluated outputs span four MVTec AD categories; each shows the input, ground-truth mask, continuous anomaly-map overlay, and thresholded prediction.
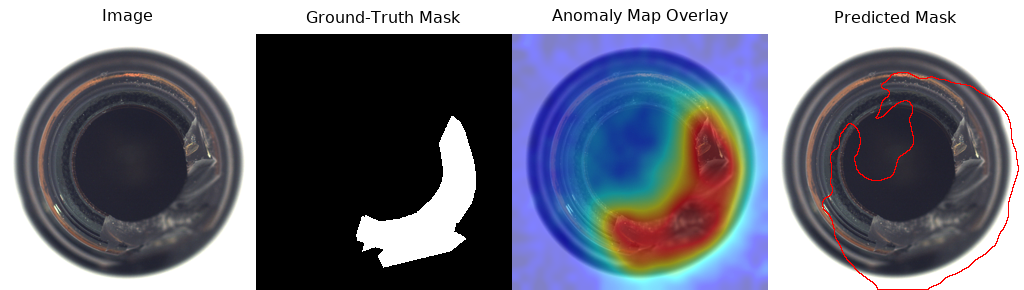
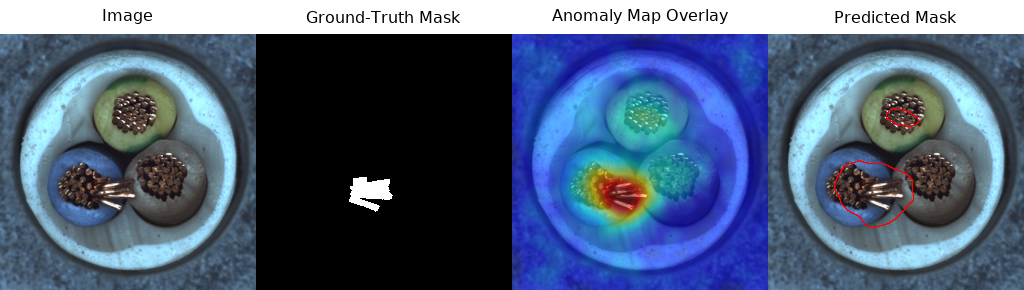
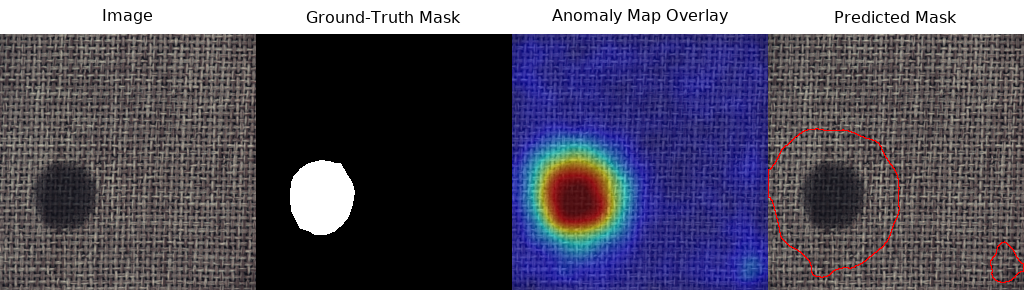
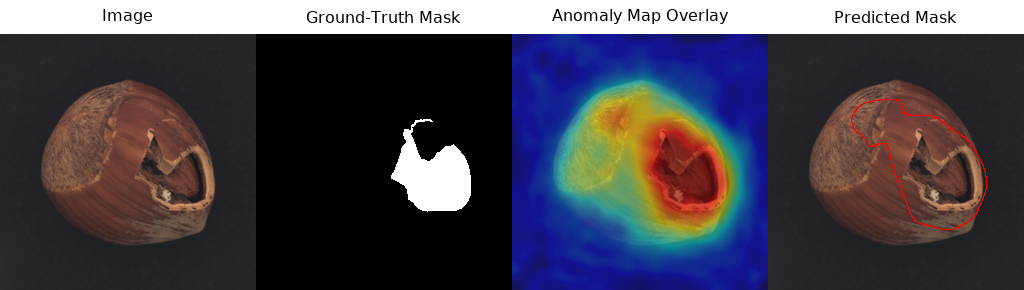
Selected from regenerated PatchCore outputs used in the project evaluation. Open any result for a full-size view.
Evaluation choices
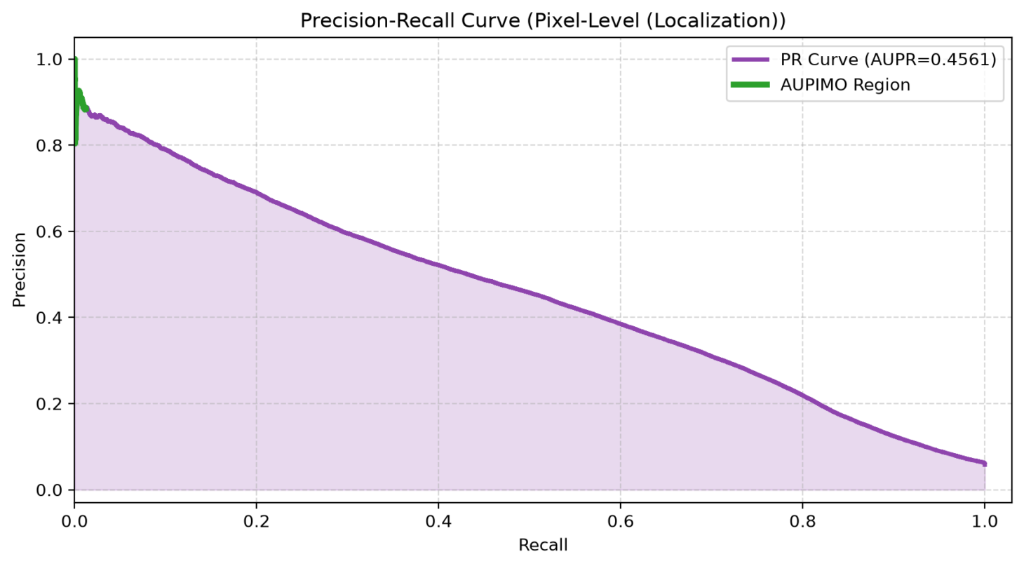
Given the extreme pixel imbalance, localization reporting uses AUPIMO rather than relying on pixel AUROC alone, while image-level evaluation uses F1 and precision-recall behavior with threshold sensitivity treated explicitly.
Defect prevalence also varies sharply by category: anomalous-pixel ratios range from roughly 0.34% for screw to 14.5% for metal nut. That heterogeneity is reflected in both threshold behavior and localization difficulty.
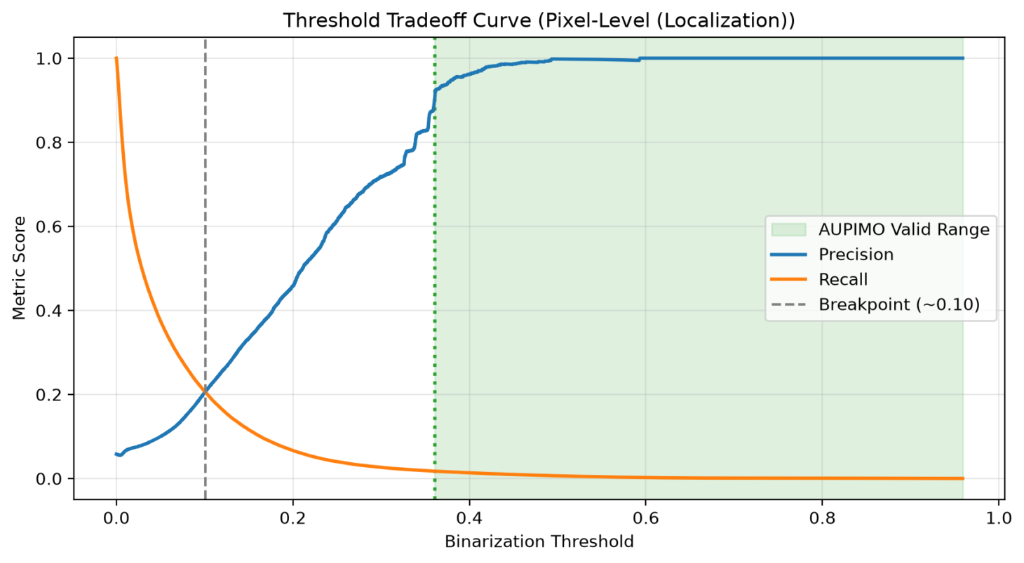
Evaluated PatchCore baseline
Across the completed 15-category baseline, AUPIMO reached 0.982 for bottle and 0.972 for leather, while zipper fell to 0.251. Screw was the hardest image-level category at F1 0.796.